MSP Chart of Accounts: How to Structure QuickBooks for Accurate Reporting
Most MSPs don’t have a bookkeeping problem.
They have a structure problem.
If your chart of accounts in QuickBooks (Desktop or Online) wasn’t built specifically for a managed service provider, your financial reports are likely misleading — even if your books are clean.
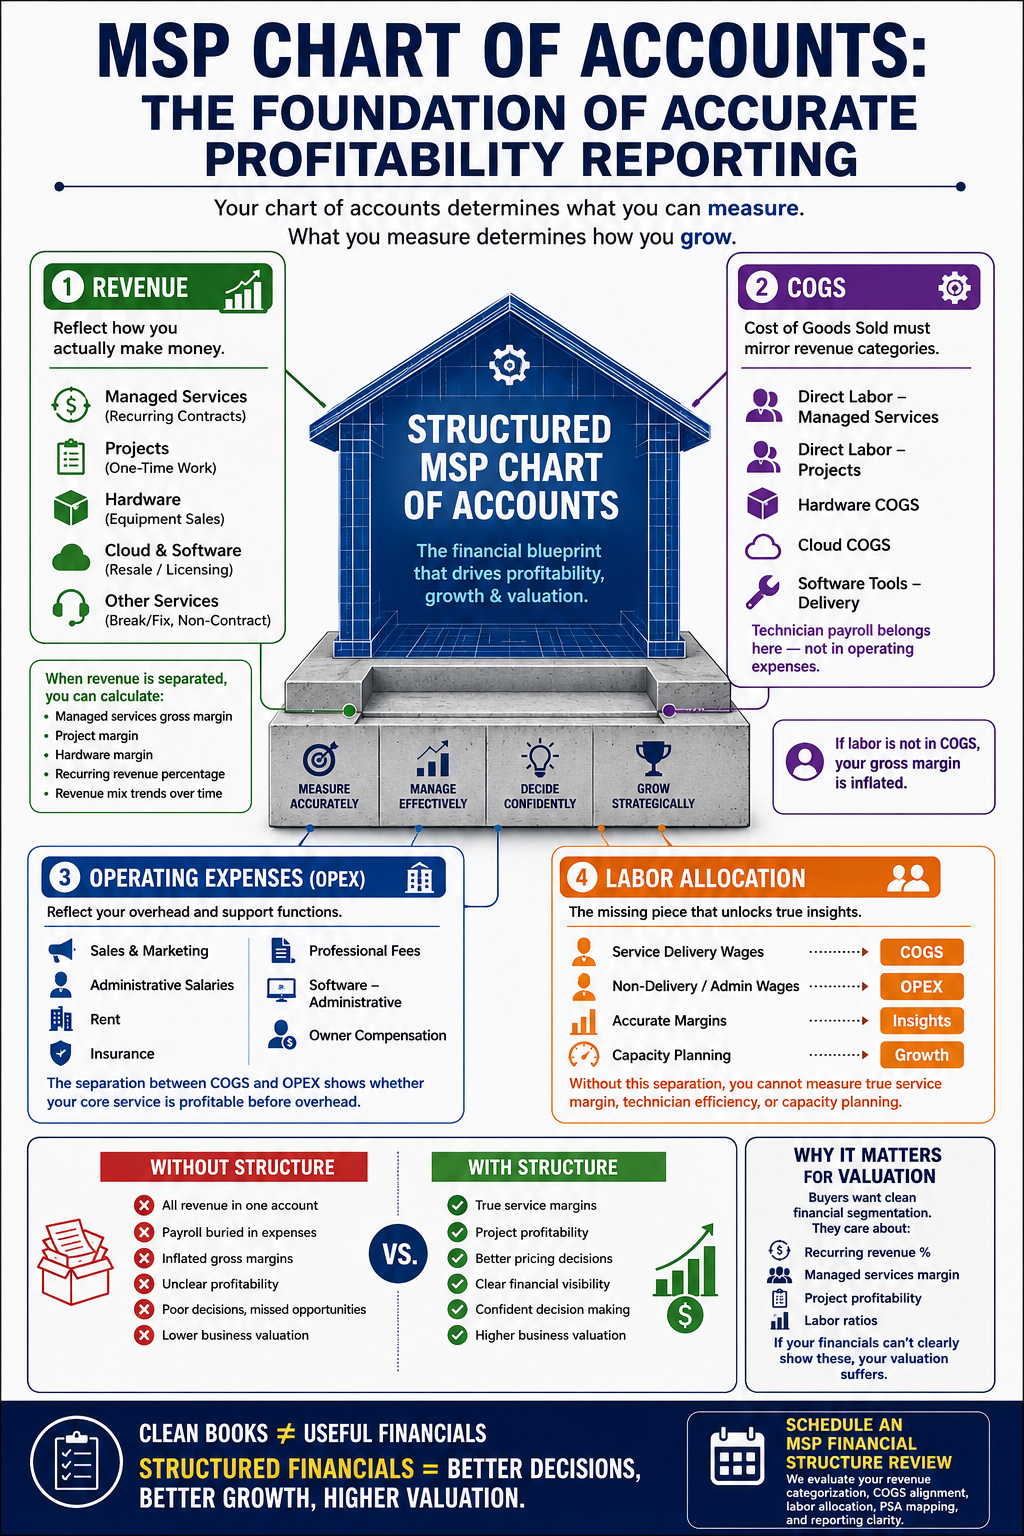
Your chart of accounts determines what you can measure.
And what you measure determines how you grow.
Why Generic QuickBooks Setups Fail MSPs
Most QuickBooks files start one of three ways:
• Converted from another business
• Created by a generalist bookkeeper
• Left at QuickBooks default settings
None of those are designed for recurring revenue models, PSA integrations (ConnectWise or Halo), service-line margin tracking, or labor allocation modeling.
If your P&L only shows income, cost of goods sold, and expenses without proper segmentation, you cannot see true profitability by department.
Revenue Structure for MSPs
Your income accounts should reflect how you actually make money.
At minimum, separate:
1. Managed Services Revenue
Your monthly recurring service contracts. This is your most valuable revenue stream and should always stand alone.
2. Project Revenue
One-time implementation, migrations, infrastructure work. Projects carry different labor demands and margin profiles.
3. Hardware Revenue
Physical equipment sales. This allows you to isolate lower-margin resale activity.
4. Cloud & Software Resale Revenue
Licensing, Microsoft 365, security tools, SaaS resale.
5. Other Service Revenue
Break/fix or non-contract support.
When revenue is separated, you can calculate:
• Managed services gross margin
• Project margin
• Hardware margin
• Recurring revenue percentage
• Revenue mix trends over time
Cost of Goods Sold (COGS) Structure
COGS must mirror revenue categories.
Recommended COGS accounts:
• Direct Labor – Managed Services
• Direct Labor – Projects
• Hardware COGS
• Cloud COGS
• Software Tools – Delivery
Technician payroll must be allocated here — not buried in operating expenses.
If labor is not in COGS, your gross margin is inflated.
Operating Expenses (OPEX)
Once direct costs are categorized correctly, operating expenses should reflect overhead.
Typical MSP operating expenses:
• Sales & Marketing
• Administrative Salaries
• Rent
• Insurance
• Professional Fees
• Software – Administrative
• Owner Compensation
The separation between COGS and OPEX is critical for understanding whether your core service is profitable before overhead.
Labor Allocation: The Missing Piece
Your chart of accounts is only powerful if labor is structured correctly.
MSPs often struggle with:
• All payroll in one expense line
• No separation between service and admin staff
• No allocation based on billable activity
You need:
• Service delivery wages in COGS
• Non-delivery wages in OPEX
Without this separation, you cannot measure true service margin, technician efficiency, or capacity planning.
QuickBooks Desktop vs. QuickBooks Online Considerations
Both can support proper MSP structure.
Desktop offers stronger job costing features.
Online offers easier integrations and automation.
The key is not the version — it is the structure and proper PSA mapping.
What a Properly Structured MSP P&L Should Show
At a glance, you should be able to see:
• Total revenue by category
• Gross margin by category
• Total direct labor
• Overhead as a percentage of revenue
• Net operating profit
If you cannot clearly identify which part of your business is generating profit, your structure needs attention.
Warning Signs Your Chart of Accounts Needs Redesign
• All revenue in one account
• Technician wages in operating expenses
• No separation between hardware and service cost
• Gross margin above 70 percent
• Inconsistent monthly margins
These are structural issues — not bookkeeping errors.
Why This Impacts Valuation
If you ever plan to sell your MSP, buyers want clean financial segmentation.
They care about:
• Recurring revenue percentage
• Managed services margin
• Project profitability
• Labor ratios
If your financials cannot clearly show those metrics, your valuation suffers.
Final Thought
Your chart of accounts is not just an accounting list.
It is the financial blueprint of your MSP.
When structured correctly, it becomes:
• A pricing tool
• A hiring guide
• A forecasting model
• A valuation asset
When structured incorrectly, it becomes a reporting illusion.
Schedule an MSP Financial Structure Review
If you use ConnectWise or Halo with QuickBooks Desktop or Online and are not confident your chart of accounts supports accurate margin reporting, it may be time for a redesign.
In a focused MSP Financial Structure Review, we evaluate:
• Revenue categorization
• COGS alignment
• Labor allocation
• PSA mapping
• Reporting clarity
Because clean books are good.
But structured, decision-ready financials build real growth.